wikithinkers Downloadable PDF version of the graph of Wikipedia Thinkers.
wikithinkers Downloadable PDF version of the graph of Wikipedia Thinkers.
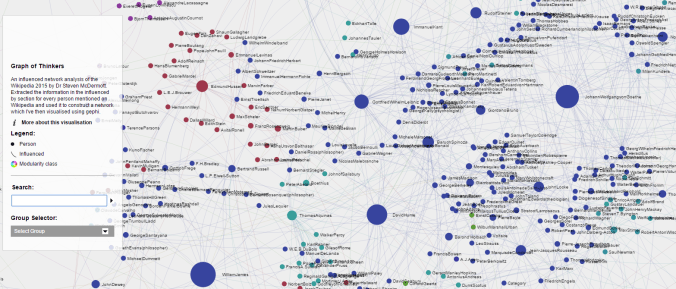
Interactive Version
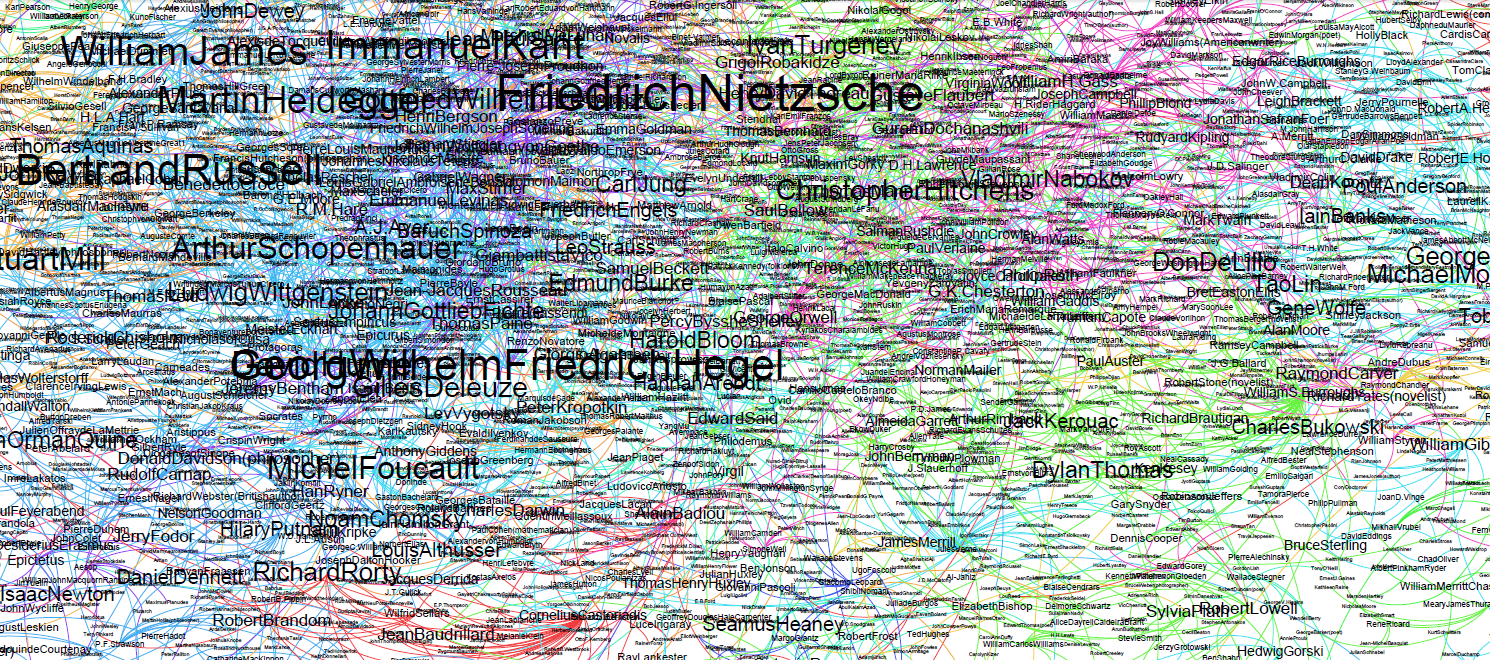
Graphs of Wikipedia: Influential Thinkers –
While I work out how to extract data from Wikipedia thought I should post this here.
The bigger the node, the larger the betweenness centrality score i.e. the bigger influence that person had on the rest of the network. These are the most influential figures in the network. However I do agree with…
This however brings us to one of the largest problems in doing work like this; the graph is intrinsically “wrong”. Brendan Griffen.
The inspiration for this graph was from Griffen – who had promised to make the interactive version of his graph available but is yet to do so.
To show just how “wrong” these graphs are – here is exactly the same data but this time a different algorithm (hub) has been used to size the nodes…

Interactive map
The map is only useful when you zoom in close to particular areas or type in a name in the search function.
Below is a close up of a red section that on closer inspection is a group of comedians…

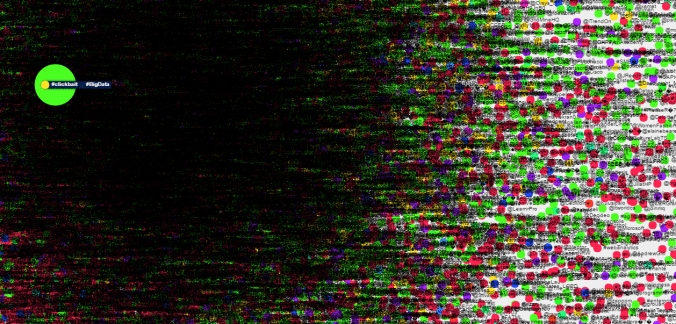
#big data as #clickbait visualisation of Tweets in July 2015
Interactive visualisation of the Tweets that contained the hashtag #bigdata July 2015. As it contains approximately 50,000 nodes and 130,000 edges it takes a little bit of time to load. Another hashtag closely linked to #bigdata is #clickbait. This may be indicative of the bandwagon effect being one interpretation of what #bigdata is and why it is such a popular concept.
The source of seed blogs and websites is this list of Top Analytic Blogs and Web Sites is http://www.analyticbridge.com/profiles/blogs/top-analytic-blogs-and-websites-with-trending-information. This analysis is based on data submitted on sign-up by 16,000 Analyticbridge members, between February 2008 and December 2011.

Interactive visualisation of a hyperlink analysis of blogs and websites associated with Big Data and analytics.
